Steamify · B2C, Web App
Steam trading
management dashboard
About product
Steamify is a web automation tool for Steam traders. Buy and sell items, track analytics, set price thresholds, monitor competitor prices, and more. It supports platforms like MarketCSGO, Waxpeer, ShadowPay, Buff, and others.
Idea and problem
Market
There were only two bots available on the market.
Problem
Based on our analysis, the key issues we aimed to address were:
- Inconvenient and non-transparent account management.
- An unintuitive and uncomfortable user interface.
- No item-level analytics.
- Limited platform integrations for trading.
Competitors also tended to be passive in engaging with users and slow to respond to requests for product improvements.
Process
While the CEO and I were in Thailand, we worked closely on the project on a daily basis. The pace felt similar to a hackathon — we made decisions quickly, iterated fast, and constantly refined the product together.
At times, discussions were intense and complex, and misunderstandings naturally arose in such a fast-moving environment. In situations where we had different perspectives, I took ownership of validating ideas through user experience principles, business impact, and feasibility.
This helped us evaluate options objectively and make aligned decisions. Ultimately, we always found common ground, clarified priorities, and moved forward with a shared vision.
How did we measure success?
We evaluated product success with two core metrics: user growth and user feedback.
As market benchmarks, we only had visibility into our competitors’ user numbers. As of March 3, 2024, we had already surpassed both competitors, reaching 70 users in beta.
- Steamify users in beta
- 70
- TradeLab users
- ≈ 50
- TradeOn users
- ≈ 40
We measured qualitative performance through direct chat feedback. User responses were highly positive, with strong engagement and satisfaction signals.
Overview
The Overview page is a centralized dashboard with key performance indicators across all Steam accounts connected to Steamify: revenue, volume and items sold, plus balances, inventory and inventory value broken down by marketplace.
Users can pick a time range in the integrated calendar, and the chart shows sales per marketplace for any day on hover. All data updates in real time via WebSocket integration.
Profiles
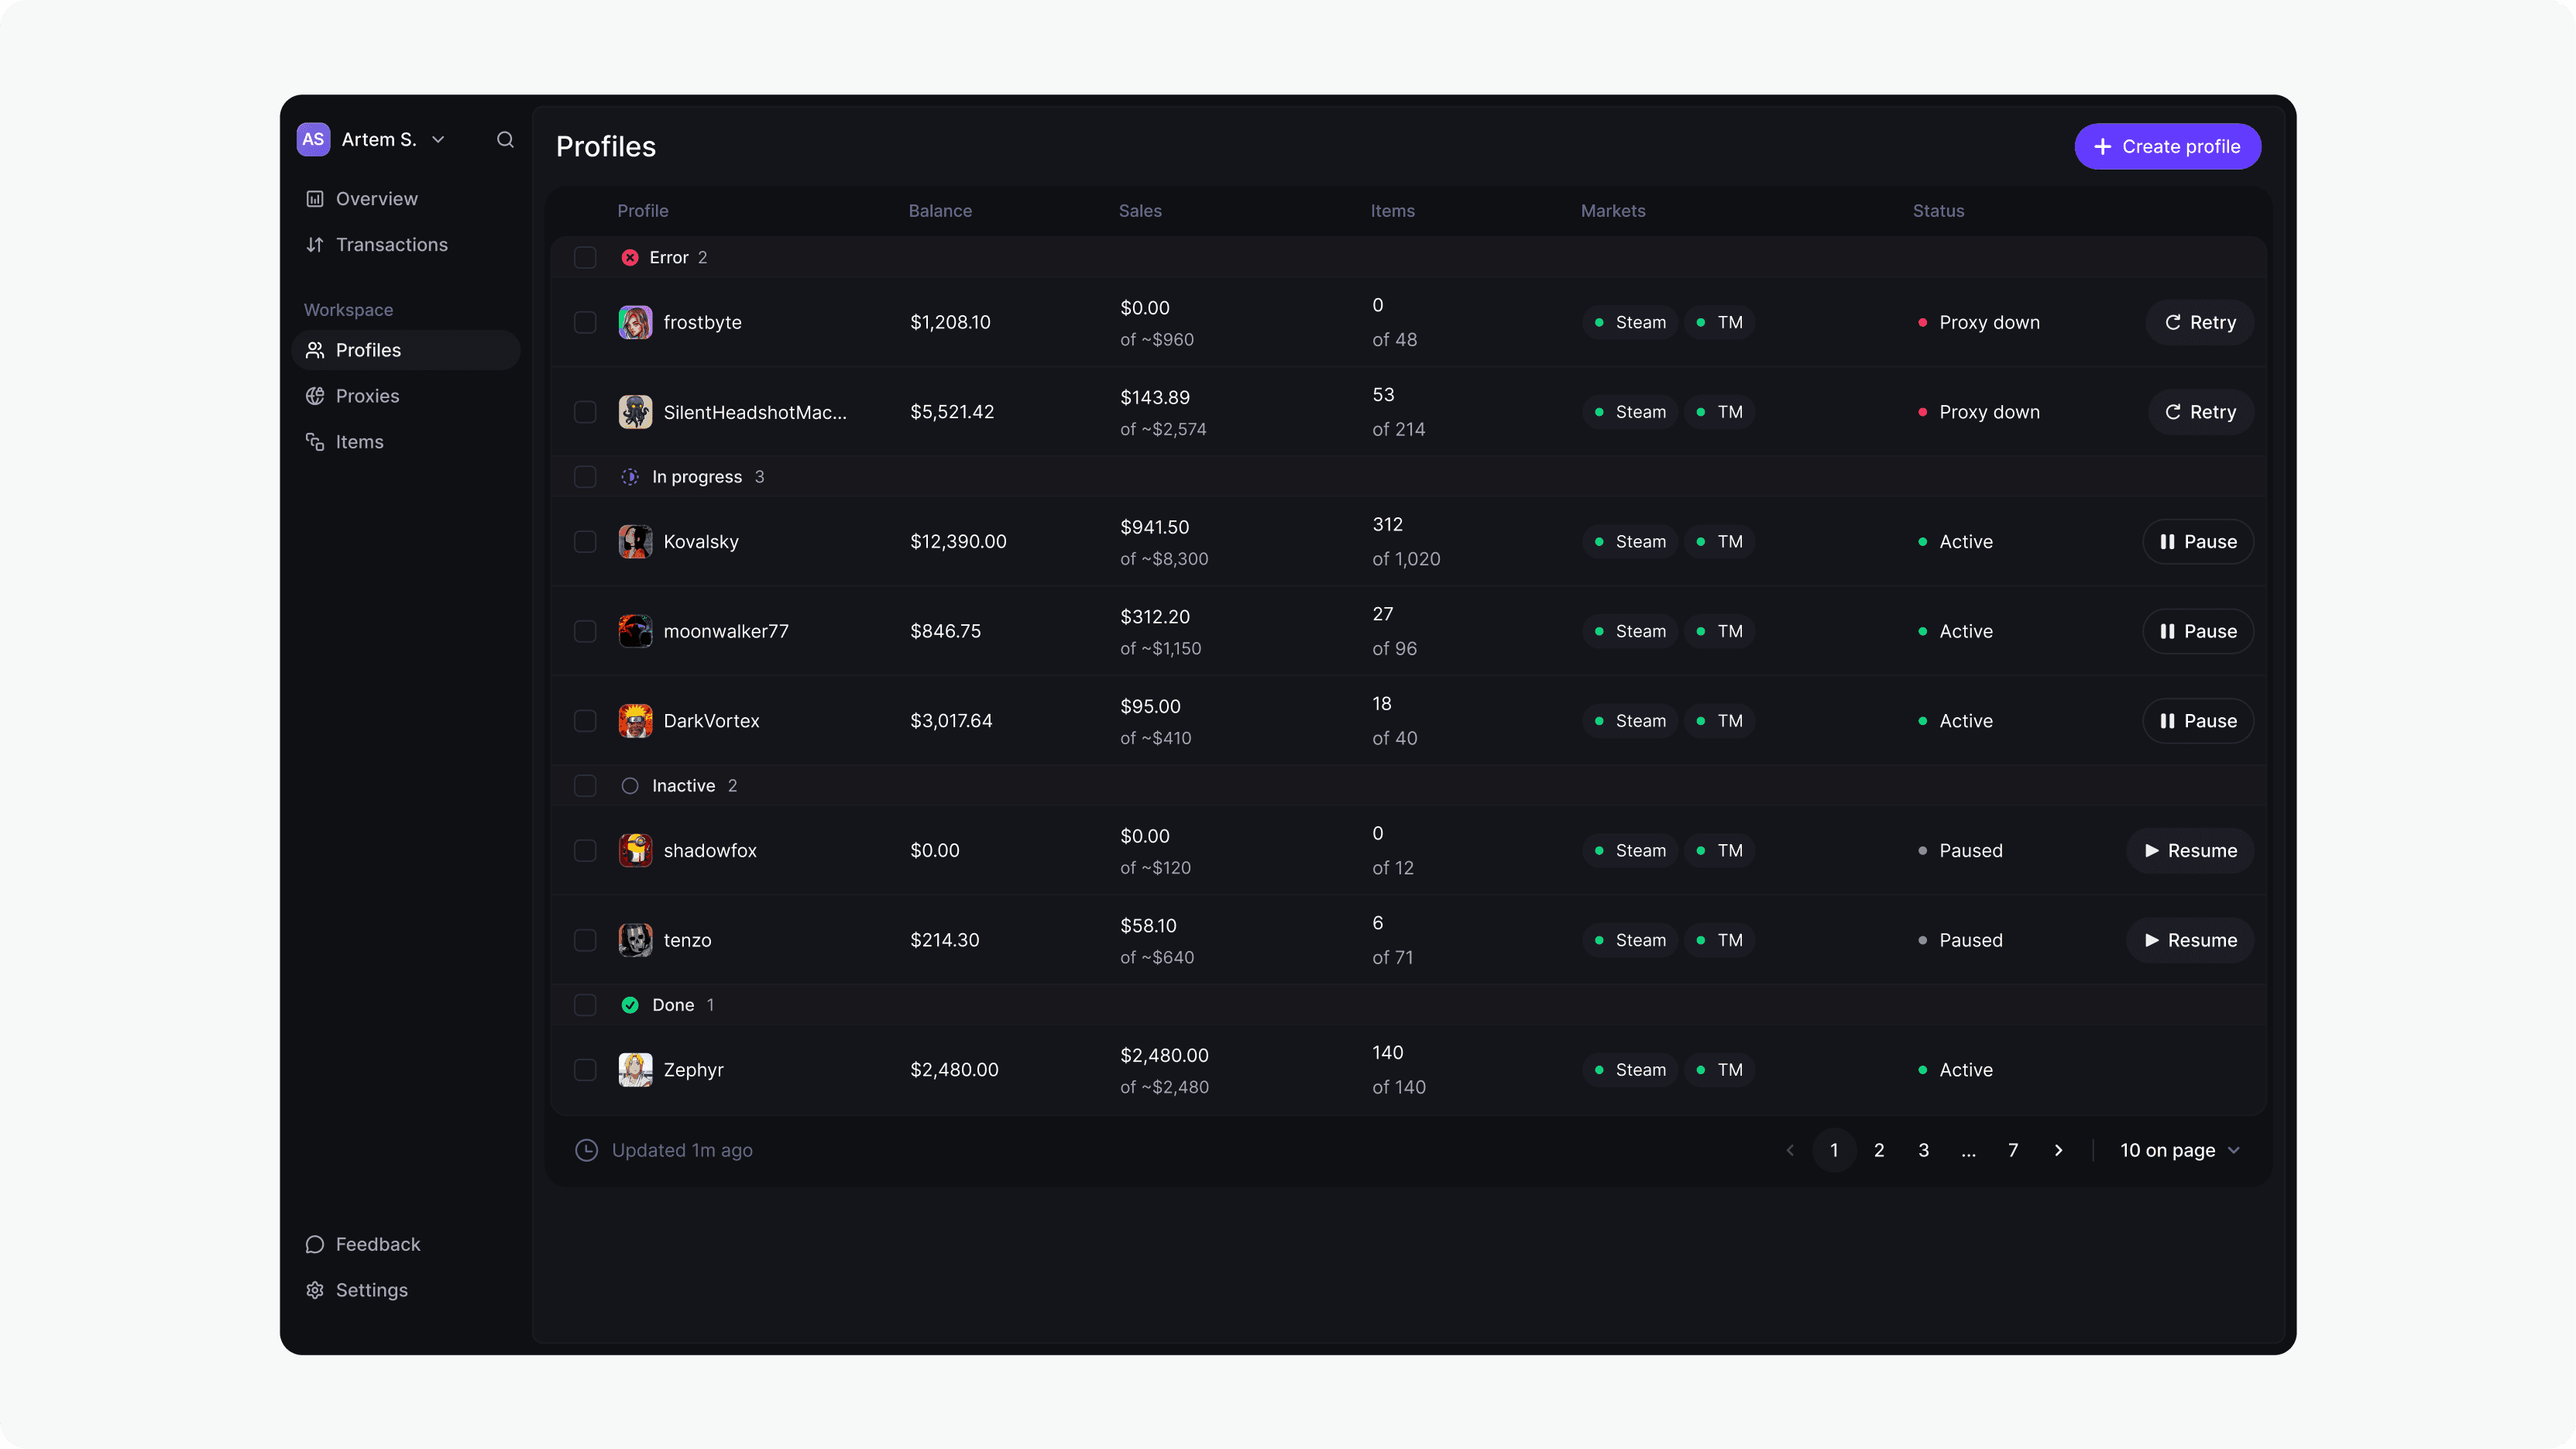
Profiles represent the bots responsible for selling users’ items. Each profile can have one of four statuses: Error, In Progress, Inactive or Done.
Each profile displays key operational data, including current balance, total revenue from sales, estimated inventory value, total number of items, as well as API key and proxy status — ensuring transparency and control over the selling process.
Outcomes and learnings
Working in a fast-paced, hackathon-like environment taught me to prioritize momentum over perfection — shipping fast, validating early, and continuously improving based on feedback rather than overpolishing initial solutions.
I enhanced my communication within the team by clearly articulating and confidently advocating for design decisions, ensuring they were aligned with user needs, business objectives, and technical feasibility.
I deepened my frontend knowledge, which improved collaboration with engineers and allowed me to communicate in the same technical language. This enabled me to contribute to decisions around UI libraries and component architecture — for example, integrating the Sonner library to enhance system feedback and interaction clarity.